
Question 18
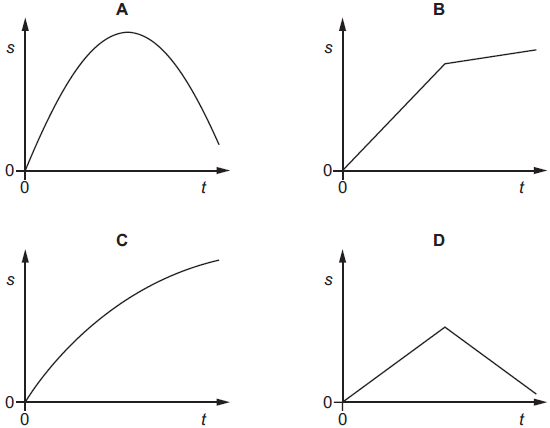
The velocity of an object changes with time t
as shown.

Which graph
best shows the variation with time t of the displacement s of the object?
Reference: Past Exam Paper – June 2018 Paper 12 Q5
Solution:
Answer:
A.
The gradient of a
velocity-time graph gives the acceleration.
The area under a velocity-time
graph gives the displacement.
When the velocity is
positive, the displacement increases even if the magnitude of the velocity
decreases.
e.g.
if velocity = + 10 m
s-1, the displacement increases by 10 m in each second
if velocity = + 5 m s-1,
the displacement increases by 5 m in each second
The displacement still
increases even if the velocity is decreasing (as long as it is positive).
When the velocity is
negative, the displacement decreases. [B and C are incorrect]
Now, the gradient of a displacement-time
graph gives the velocity.
Graph D gives a constant
gradient for the increase and a constant gradient for the decrease. This
implies that during the increase, the velocity is constant – it is not
changing. But this is incorrect as we can see from the graph that the velocity
DECREASES from a maximum value to zero for the first section. [D is incorrect]
No comments:
Post a Comment
If it's a past exam question, do not include links to the paper. Only the reference.
Comments will only be published after moderation